Note
Click here to download the full example code
Imperial College London Sandstones & Carbonates 2009 Dataset
This example shows how we can load an image from the Imperial College London Sandstones & Carbonates 2009 dataset.
from drd.datasets.icl_sandstones_carbonates_2009 import load_icl_sandstones_carbonates_2009
import matplotlib.pyplot as plt
Loading the Image
We will use one of the utility functions called load_icl_sandstones_carbonates_2009 to generate an xarray DataArray which already contains all the spatial axis information and scaling preconfigured.
This way we will have a proper definition of the image data in terms of a spatial coordinate system.
img = load_icl_sandstones_carbonates_2009("Berea")

# This is the end of the 'code block' (if using an above IDE). All code within
# this block can be easily executed all at once.
Out:
Using downloaded and verified file: /home/runner/drd_data/Berea.7z
Plotting the Image Data using xarray
We will use xarray’s ability to summarize or select our data to plot an average over the z dimension.
img.mean(dim='z').plot()
plt.tight_layout()
plt.show()
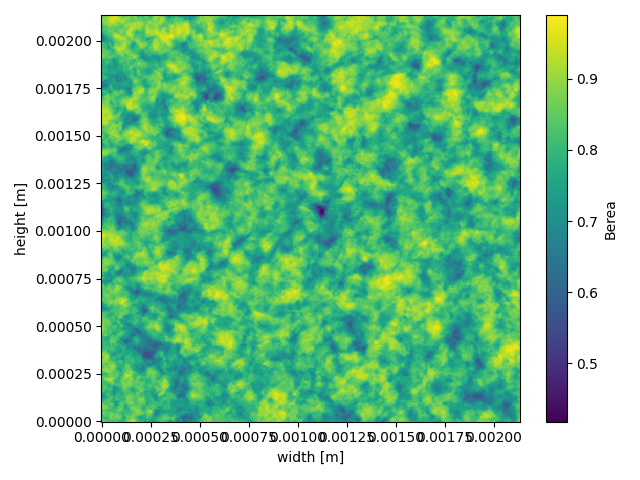
We can clearly see how we first downloaded the image data from the web and subsequently compute an average over the micro-ct image dataset.
Total running time of the script: ( 0 minutes 0.936 seconds)